Play Index: Roy Halladay and the Cardinals edition

Roy Halladay died way too young in a plane crash on Tuesday. This is the worst sort of news, and the entire baseball world just felt numb yesterday. There have already been plenty of wonderful tweets and columns on his career and untimely passing that hit the mark way better than I could  so that’s not what I’m going to do here today. Plus, I’m not qualified to do that. I missed most of Halladay’s brilliance, since the bulk of his career was spent with Toronto in the American League.

My limited exposure to Halladay occurred when he was in a Phillies uniform the last few seasons of his career and pitching against the Cardinals, and all I can say is that he was terrifying. Without doing a deep numbers dive, I was more afraid of him in 2010 and 2011 than I have been of Clayton Kershaw, Madison Bumgarner, or any other recent pitcher you want to name. He felt invincible. That the Cardinals beat him in Game 5 of the 2011 NLDS, on the strength of Rafael Furcal and Skip Schumaker, no less, still doesn’t quite seem possible.

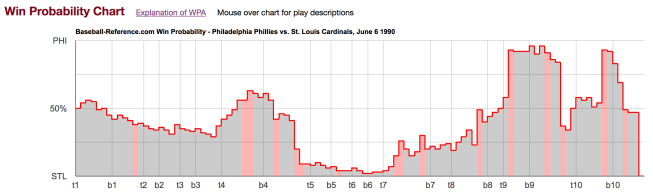
It seems unfair to Halladay that many on the Cardinals side of the aisle first conjure up Game 5 when thinking of his legacy since it was a game that he lost, but when something like this happens it’s only natural to reach into one’s own memory bank and that was one of the most thrilling nine innings of baseball most of us have ever seen. I recommend visiting Viva El Birdos if you want to read some great pieces on that game. And, it’s not at all an insult because what helped make that game so special was Halladay’s obvious dominance.

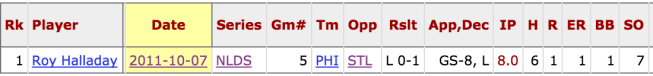
He pitched eight strong innings, struck out seven, walked only one batter (and it was an intentional pass to Albert Pujols – who had a career .461 OPS against Halladay), and allowed just a single run. That run, of course, turned out to be enough for the Cardinals, and Halladay got the “loss” as a result of baseball’s unfair and sometimes antiquated ways.

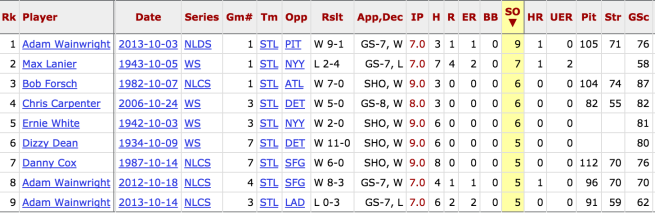
But take a look at that pitching line again. From Baseball Reference’s Play Index, here’s how many times the Cardinals have won a regular season 9-inning game (dating back to 1913) when the opposing pitcher matched or topped that line and took the loss:

Screen Shot 2017-11-08 at 3.55.47 PM

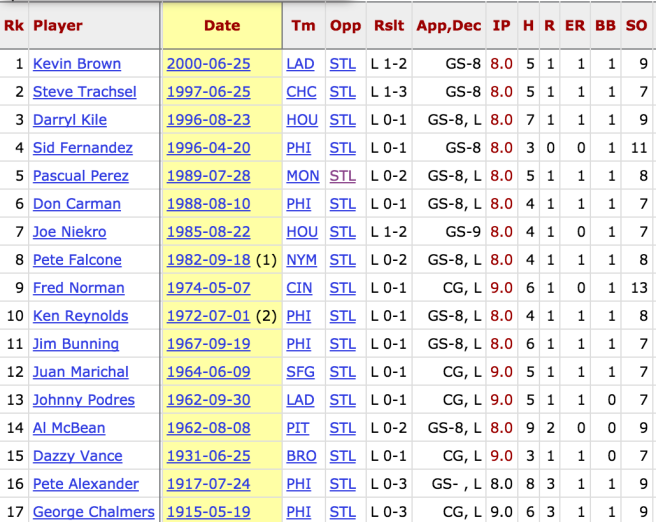
Over 100 years of data and that’s the entire list. And, no shock, if you want to limit the search to just the postseason then this is all that you will find:

Screen Shot 2017-11-08 at 3.56.33 PM

Game 5 was a true gem. And let’s be clear: the Cardinals didn’t really beat Roy Halladay that night. They just got lucky that Chris Carpenter was pitching, too. Rest in peace, Doc, you were one of the best.

Credit to Baseball Reference’s Play Index for most of the stats in this post. Subscribe to the Play Index here


Updated MLB franchise rankings in the wild card era

Last June I devised my own simple formula at Viva El Birdos to rank all 30 MLB franchises in the wild card era. To explain, here’s the pertinent text from that post:

From 1995 to 2016, each team gets:

  • +1 point for every regular season game won;
  • +15 points for every division title;
  • -10 points for every last place finish;
  • +2 points for every playoff game won;
  • +20 points for a Pennant; and
  • +50 points for a World Series title.

Now, a couple of things before we get to the numbers. First, the Diamondbacks and Raysdidn’t join the league until 1998. I averaged their win total by season from 1998-2016 to fill in the blanks for 1996 and 1997, and pro-rated that average win total to fit the 1995 144-game strike-shortened schedule. But they’re at a disadvantage because those are three seasons in which they didn’t have the opportunity to accrue points by playoff wins, pennants, etc. On the other hand, they would have been expansion clubs so if anything this just saved them from being docked 10 points a couple of times because of possible last place finishes.

Second, I awarded the Cardinals a division title in 2001 as well as the Red Sox in 2005, even though they were technically the wild card but finished with the same respective record as the division winning Astros and Yankees. In similar fashion, the Rockies and Diamondbacks were both docked 10 points for finishing with the same last place record in the NL West in 2006, and same with the Royals and Indians in 2009. And no points were awarded for winning the wild card. Those teams are left with the points from what should be a decent amount of regular season wins and whatever they were able to accomplish in the postseason (i.e., the 1997 and 2003 Marlins). As you’re going to see, that hurt teams like the Pirates but I didn’t see the need to award a team who neither won the division nor went far in the playoffs.

With all that taken into consideration, here’s how the 30 teams ranked by points:

  1. Yankees – 2,854
  2. Cardinals – 2,418
  3. Braves – 2,352
  4. Red Sox – 2,297
  5. Giants – 2,233
  6. Indians – 2,116
  7. Angels – 2,059 (tie)
  8. Dodgers – 2,059 (tie)
  9. Rangers – 1,947
  10. Phillies – 1,935
  11. White Sox – 1,916
  12. Mets – 1,892
  13. Athletics – 1,891
  14. Diamondbacks – 1,850
  15. Cubs – 1,839
  16. Astros – 1,837
  17. Marlins – 1,802
  18. Mariners – 1,774
  19. Reds – 1,766
  20. Blue Jays – 1,756
  21. Tigers – 1,752
  22. Padres – 1,736
  23. Twins – 1,731
  24. Orioles – 1,711
  25. Brewers – 1,662
  26. Nationals/Expos – 1,658
  27. Royals – 1,640
  28. Rockies – 1,632
  29. Rays – 1,613
  30. Pirates – 1,520

Since the 2017 season concluded about 32 hours ago, I thought it worthwhile to update the rankings, and here they are as sorted by the total points in the last box (I apologize for the crowded text):

1995-2017

Team Regular Season Wins Division Titles Last Place Finishes Total Playoff Games Won Pennants World Series Titles Total Points
1. Yankees

2,162

13

0

106

7

5

2,959

2. Cardinals

2,014

11

0

71

4

2

2,501

3. Braves

2,044

12

1

50

3

1

2,424

4. Red Sox

2,035

6

3

51

3

3

2,407

5. Giants

1,926

5

4

48

4

3

2,287

6. Indians

1,958

9

1

47

3

0

2,237

7. Dodgers

1,999

9

0

32

1

0

2,218

8. Angels

1,957

6

2

21

1

1

2,139

9. Astros

1,852

5

3

29

2

1

2,045

10. Rangers

1,898

7

6

21

2

0

2,025

11. Phillies

1,832

5

6

27

2

1

1,991

12. White Sox

1,854

3

1

12

1

1

1,983

13. Mets

1,858

2

2

27

2

0

1,962

14. Athletics

1,896

6

7

15

0

0

1,956

15. Cubs

1,819

5

6

25

1

1

1,954

16. Diamondbakcs

1,824

5

6

18

1

1

1,945

17. Marlins

1,755

0

6

22

2

2

1,879

18. Mariners

1,847

3

7

15

0

0

1,852

19. Blue Jays

1,837

1

4

10

0

0

1,832

20. Reds

1,799

3

3

5

0

0

1,824

21. Twins

1,784

6

7

6

0

0

1,816

22. Padres

1,781

4

7

8

1

0

1,807

23. Tigers

1,726

4

7

25

2

0

1,806

24. Orioles

1,766

2

5

15

0

0

1,776

25. Nationals/Expos

1,780

4

8

7

0

0

1,774

26. Brewers

1,751

1

3

6

0

0

1,748

27. Royals

1,661

1

9

22

2

1

1,720

28. Rockies

1,751

0

7

9

1

0

1,719

29. Rays

1,717

2

10

13

1

0

1,693

30. Pirates

1,679

0

9

3

0

0

1,595

There really isn’t much change at the top but the Astros jumped from number 16 to the ninth spot, with 208 total points alone as a result of their just-completed World Series season and knocked the Phillies out of the top-10. The Yankees, Cardinals, and Dodgers remain the only three franchises to not have a last-place finish in the Wild Card era, a feat that shouldn’t go unnoticed by Cardinals fans even if the team did just finish with their lowest win total since 2007. And the Marlins, Rockies, and Pirates are still searching for their first division title during this span. I’m no Dan Szymborski but given the current divisional landscape I suspect that will still be the case exactly a year from now.

By this formula the Cardinals can still claim the title of the second best franchise in MLB since the wild cards were introduced. Barring something unforeseen, the only thing that could dislodge them from that spot after next year would be another Red Sox World Series title (I feel comfortable saying that the Braves are not yet a credible threat on that front next season). If you’re one of the few who cares about these things then take comfort in that, and ideally the Cardinals will add to their point total next season with more than just regular season wins.

The Cardinals and Game 7

Heading into tonight’s Game 7 of the 2017 World Series between the Dodgers and the Astros, I share the sentiment that I have seen expressed elsewhere that watching games like Game 2 or Game 5 of this series is a delight when there are no rooting interests at stake and absolutely terrifying when there are. So I can only imagine what Dodgers and Astros fans are feeling right now. And if tonight’s game turns out to be a nail-biter then Godspeed to all of them.

The rubber match of a three game series in May can tie my stomach in knots. A Game 7 to decide the entire season is another level of indescribable agony. One game to see if a new flag will fly. One game to see if an off-season of enormous goodwill awaits or if I’ll be sorting through various what-if scenarios in my head for a lifetime.

When I was eight the Cardinals went seven with the Minnesota Twins in the 1987 World Series. In almost every way imaginable the Cardinals were the superior club. The Twins even had a negative run differential for the regular season, which should rank right up there for absurdities with an 83-win team winning the World Series. But the Cardinals were banged up, and the Twins had the homefield – the Metrodome and their dreaded white roof, which felt like some level of cheating at the time.

Or maybe that was my impression based on how inept the Cardinals looked on the road in that series. Heading into Game 7 in Minnesota, the home team had won every game, which at the time was a first, and the Cardinals had been outscored at the Metrodome by 19 runs in Games 1, 2, and 6. Suffice to say, the feeling heading into Game 7 was never good. Cruelly, I was forced to go to bed before it was over with the score tied 2-2. Worse, my parents woke me up a few hours later and told me that the Cardinals lost 4-2.

The next morning I convinced myself maybe that didn’t actually happen. Maybe the Cardinals won? Maybe my favorite team had won the World Series? Nope. For the second time in just a few hours I had to be told that the Cardinals, in fact, lost the World Series. It was the first time I cried about sports.

That was not the first or last disappointing Game 7 of my lifetime. Oddly, looking back, it feels like one of the better ones. Coming off the Denkinger game in 1985, the Cardinals turned in perhaps the worst Game 7 performance that baseball has seen in the World Series and lost 11-0. And they had blown a 3-1 series lead. The Cardinals also blew a 3-1 lead in the 1996 NLCS and lost 15-0 to the Braves in Game 7. And another 3-1 lead in the 2012 NLCS to the Giants, only this time they lost 9-0 in the decisive game. Three 3-1 leads blown and then outscored by a football score of 35-0 in the three Game 7s. That doesn’t even seem possible.

That is why Game 7s make me anxious. I don’t want anything to do with them. And yet, the Cardinals actually have an exemplary record in World Series Game 7s, both recently and historically.

Of their 19 trips to the World Series, 11 have gone the distance and they have won 8 of them, more than any other team. Maybe it’s time to stop being so torn up about all those Game 7 misses from years ago.

On another note, everyone enjoy the game and unless you’re a Dodgers or Astros fan, rest easy knowing you can watch tonight in peace. And if you are a Dodgers or Astros fan, just try to survive.

How to spot a truly special World Series game

On June 6, 1990, newly-named coach Willie McGee hit a double with the bases loaded in the bottom of the 10th inning to score Rex Hudler and Denny Walling, allowing the Cardinals to beat the Phillies in walk-off fashion. Moments earlier, Walling had singled to score Milt Thompson to jump-start the needed rally.

It had already been a wild game, with six different lead changes from beginning to end. With two outs in the bottom of the 9th, Pedro Guerrero singled to score McGee and Ozzie Smith in order to force extras. Meaning the Cardinals entered the bottom of the 9th down two and tied the game. Then, they entered the bottom of the 10th down two runs again and scored three to win the game 12-11. From Baseball Reference, here’s what the win probability chart looked like:

Screen Shot 2017-10-28 at 12.35.48 PM

I still remember this game even though it was more than 27 years ago and happened to occur in the middle of one of the most underwhelming seasons in franchise history. And I was reminded of this game in the aftermath of Game 2 of the ongoing World Series, a crazy, back-and-forth affair that ended with a 7-6 Astros win. (If you haven’t read it yet, I highly recommend Grant Brisbee’s piece on the game.) That’s because if Game 2 of the 2017 World Series had been some random game in May it would have still been remarkable. The same absolutely applies to Game 6 from 2011 World Series (six years old, yesterday), probably even more so.

The events from those games were already beyond belief. Put those games in the middle of the regular season and they would still be a big deal. Put them on the biggest stage with most of the sports world watching and they are rightfully in another stratosphere. Craig Edwards of FanGraphs (and my old boss at Viva El Birdos) had a great piece outlining the historical craziness of the two games, which is worth reading because sometimes it takes seeing the unlikely course of events in print to really appreciate them. And returning to that meaningless 1990 regular season game from above – had it occurred in October it would probably also be the stuff of legends.

And this is where Game 7 of the 2016 World Series fails to live up to Game 6 in 2011 and Game 2 from a few days ago. It was nuts, to be sure. But it was mostly context-driven: Two championship-starved teams (to put it mildly), a rain delay right in the middle of all the drama, and the fact that it was by definition the last game of the season. Remove all of that and I don’t think you have anything too remarkable. Cleveland never had the lead. And there was never a moment when Cleveland appeared seconds away from miraculously winning the World Series. Put that game in the regular season and the next day it likely reads like a game the Cubs almost blew but didn’t, and that’s about it.

That said, I don’t blame a single Cubs fan for believing it was the greatest game of all time – as many of them do. I probably would too if I’m in their shoes. In fact, the 2006 World Series – an affair with way less drama, intrigue, and pretty much everything else when compared to the 2016 World Series – is something that in many ways is more dear to me than 2011. It was the first time I saw the Cardinals win a World Series (I was three-years old in 1982) after plenty of painful near-misses. That’s tough to beat. Sure, we were all watching an 83-win team take on the other league’s wild card with David Eckstein somehow being the best player on the field. Totally irrelevant. It was special. So I can only imagine the reverence that Cubs fans feel for last year’s Game 7.

Still, it wasn’t better than the game we saw the other night. It wasn’t better than Game 6. And it wasn’t even better than that stupid, meaningless Cardinals-Phillies game from a forgettable season many years ago. And that’s the test. If you plant a World Series game smack dab in the middle of June and can honestly say it would still leave a lasting impression then what you saw was something truly great.

UPDATE: Yes, last night’s Game 5 absolutely counts. Holy smokes.

The Cardinals excelled at hitting with runners on base in 2017

On the most recent FanGraphs Audio podcast, David Cameron mentioned to host Carson Cistulli that batters typically have better numbers with runners on base. That’s true. In 2017, the league had a 95 wRC+ with the bases empty, and a 99 wRC+ with runners aboard. Those are identical numbers from 2016, and in 2015, MLB hitters averaged a 101 wRC+ with runners on base but slipped to 93 with the bases empty.

I don’t know exactly why this is, and neither did Cameron and Cistulli, which is why it was brought up in the first place. It could be the smaller sample size of high leverage situations, something I believe Cistulli alluded to. Maybe there is a human element involved, and players are more focused on putting balls in play when there are runners aboard, and pitchers are more tense with the smaller margin for error.

Who knows but cue the 2017 Cardinals. When you spend an entire season with one team, your biases are relegated to them. It’s why almost everyone thinks their closer is bad. Or why unless you’re paying close attention to the stats or a team is such an obvious outlier like say the 2013 Cardinals, fans more often than not remember the missed opportunities with runners in scoring position versus the successes. You hear that all the time during individual games throughout the season, right?

I tell you what, the Cardinals are wasting too many opportunities early…

The Cardinals strand two more as we head to the 6th…

And so on. But were the Cardinals bad at hitting with runners on base in 2017? Not at all. In 2,771 plate appearances with runners aboard in 2017, the Cardinals had a wRC+ of 103, which outpaced the National League average (96 wRC+) with runners on and their own numbers with the bases empty (98 wRC+).

To further the point, here’s a look at a few more specific situations (this information can be found on FanGraphs Splits Leaderboards):

wRC+ in 2017

Cardinals

NL Average

Bases Empty

98

92

Runners On

103

96

Runners In Scoring

100

97

Bases Loaded

130

99

As is customary, the Cardinals improved with runners on base and were better than the NL average across the board. To the surprise of few, Tommy Pham was a big contributor. He hit .338/.436/.632, good for a 177 wRC+ in 243 plate appearances with runners on. Furthermore, with the bases loaded, the Cardinals had the third highest wRC+ in the NL behind the Nationals and Cubs, and hit .355/.366/.539 in such situations (161 plate appearances).

The takeaway is that the Cardinals had several problems in 2017, but they weren’t “unclutch” and they weren’t squandering too many opportunities – at least, not when compared to the rest of the league. Perhaps I’m inflating the perception that this was even at issue with the fanbase, but I heard it enough throughout the season that I thought it was worth a look.


Play Index: Adam Wainwright in the postseason edition

Clayton Kershaw was his usual, masterful self last night in the 2017 World Series opener. He went seven innings, struck out 11, gave up only three hits, and didn’t allow a single free pass, to help guide the Dodgers to a 3-1 victory over the Astros. It was a performance unlike many in the World Series, and I’m guessing the postseason altogether.

That right there tells us that no post-Musial era Cardinal has put up a similar line in the World Series, so I thought I would do a Play Index search and expand it to the entire postseason. However, searching for Cardinals who have struck out at least ten, walked zero, and pitched at least seven innings in the postseason turned up zero results. Not a huge surprise, I suppose, so I lowered the strikeout total to five and left the other parameters the same and this is what I found (as sorted by strike outs):

Screen Shot 2017-10-25 at 7.17.39 AM

Not unlike Kershaw, Adam Wainwright has a postseason reputation that has been a bit unappreciated. That happens. We remember the bad starts (Game 5 of the 2012 NLDS, Game 1 of the 2013 World Series), and tend to forget the run-of-the-mill variety. (Although, to be fair, I think everyone remembers his postseason relief appearances in 2006 quite well.) But in 89 total innings pitched in the postseason, Wainwright has a 3.03 ERA, better than the likes of Jack Morris, Randy Johnson, Pedro Martinez, to name a few, and Wainwright’s own career regular season mark of 3.29.

His postseason numbers are bolstered by his pitching in the 2013 NLDS against Pittsburgh. When I think of that series, I first go to Michael Wacha keeping the Cardinals alive in Game 4. Most of us probably do, as is the norm when a pitcher keeps the other team hitless for 7 1/3 in a win-or-go-home game.

Still, as shown above, in Game 1 of that series Wainwright came closer than any Cardinal to replicating what Kershaw did last night. It took him about 20 more pitches and he recorded two fewer strikeouts, but everything else across the board is nearly identical. Then, for good measure, he came back six days later and pitched a complete game, with six strikeouts and only one walk, to send the Cardinals into the 2013 NLCS – the place where the Kershaw “chokes in the postseason” myth was perhaps first born.

Lastly, Wainwright appears on the list above three times. No other Cardinal can claim more than a single start. Wainwright will likely never be unappreciated by Cardinals fans. In fact, it’s fair to say he’s universally beloved, which is what happens when you spend your entire career with one organization, while being one of the best pitchers in the league and an overall decent human being. That said, being one of the best postseason pitchers in Cardinals history should certainly be a part of his legacy, too.

Credit to the Baseball Reference Play Index for most of the stats in this post. Subscribe to the Play Index here.


The Cardinals’ record under Mike Matheny every day of the week

Just a heads-up, what follows is pretty stupid.

Glad we got that out of the way. I know for a fact I’m far from the only person who does this, but I have a ritual during baseball season which consists of printing out the Cardinals’ schedule, pinning it on my wall at work, and then tracking the wins and losses until the very bitter end. The end result looks like this:

IMG_0413

Notice the annotations. Those are typically reserved for memorable moments throughout the season, like walk-off wins, Matt Holliday hitting a home run in what many thought would be his last at-bat as a Cardinal, etc. Take this one, which is a pretty sad in retrospect:

IMG_0414

That was marking Oscar Taveras’s debut in May 2014, in which he homered.

Often the references are obscure enough that I have to take a minute to remind myself just what the hell I was even talking about. Like here, for instance:

IMG_0415

That was from May 2015. And “haha” was apparently my way of commemorating the Cardinals falling behind the Cubs 5-0 in the top of the 1st, only to claw their way back and eventually win 10-9 (which is always a good final score). Haha.

This is not the stupid part I warned you about. At least, it’s not stupid to me. I enjoy doing it, and it’s a good way to remember past years and to keep track of trends throughout each season.

Here comes the stupid part: I’ve been doing this for a long time, covering the entire Mike Matheny era and then some, and I was curious enough to see how the Cardinals have fared every day of the week during Matheny’s tenure. Consulting my trusty completed schedules, this is what I found:

ST. LOUIS CARDINALS, 2012-2017

Wins

Losses

Win%

Sunday

87

71

0.551

Monday

63

34

0.650

Tuesday

81

66

0.551

Wednesday

89

60

0.597

Thursday

60

49

0.550

Friday

76

80

0.487

Saturday

88

68

0.564

Total

544

428

0.560

I added all of these up by hand. Someone who knows their way around Baseball Reference a bit better than I do could have perhaps found these numbers in 60 seconds (although I’m pretty confident that sorting records by days of the week is not an available feature), but it took me about 45 painstaking, time-wasting minutes. I double-checked though and it should be accurate so respect the process.

And what I found is that for whatever random reason, since 2012, the Cardinals have easily played their worst baseball on Fridays. It’s not even close. Have you noticed you’ve oddly been in a somber mood on Saturday morning, likely the beginning of your weekend? Perhaps this is why. On the other hand, the Cardinals have played at a 105-win pace on Mondays, taking a bit of the sting off the start of the work week, so we’ll call it a wash. The other five days don’t see much variation.

There you have it. Is this important information? Absolutely not. Am I glad I took the time to figure this out? Not really. Go Cardinals, anyway.

Play Index: Jack Clark and the three true outcomes edition

Yesterday marked the 32nd anniversary of Jack Clark effectively sending the Cardinals to the 1985 World Series with a decisive three-run home run against the Dodgers in the top of the 9th inning of Game 6 of the NLCS. (Check out RetroSimba’s detailed account of the home run here.) Ozzie Smith’s walk-off home run two days earlier in Game 5 is likely more famous, but to a Dodgers fan I imagine that this one to be more devastating.

For starters, the Dodgers had a one-run lead. First base was open (Ozzie was on second, Willie McGee was on third) and Clark represented the Cardinals’ only real power threat. Remove him from that lineup and Andy Van Slyke would have led the team in home runs that season with 13. The smart move was probably to walk him, and the decision to pitch to him haunted Tommy Lasorda long after this game ended. And, there were two outs, so the Dodgers were just inches away from forcing a Game 7. At home no less. But then:

Clark may have taken it extra slow on this particular home run trot, but I remember that being his demeanor almost 100 percent of the time. If his stats didn’t tell you otherwise, you’d almost mistake him for disinterested. But a slouch he was not. In fact, Clark might be the most significant hitter in Cardinals lore to have less than 1,500 plate appearances with the organization (1,371 total, to be exact). And since this is a Play Index post, this claim can be corroborated to some degree.

Here are the top ten Cardinals as sorted by wins above replacement, with less than 1,500 plate appearances with the team:

Screen Shot 2017-10-16 at 8.15.22 PM

Story checks out.

Without question, 1987 was Clark’s finest season in St. Louis, and I’ve written about it before. To sum it up, Clark led the National League in both on-base percentage and slugging, and posted the highest walk rate (24.3%) in the NL since the league was integrated – so long as we exclude Barry Bonds.

Clark finished third in MVP voting in a competitive field with outstanding seasons turned in by teammate Ozzie Smith (who I believe should have won the award), along with contemporaries Eric Davis, Tim Raines, Tony Gwynn, and Darryl Strawberry. Andre Dawson went home with the trophy in what was probably a miscarriage of justice but he led the NL in home runs and RBIs so what can you do.

Clark’s candidacy was likely hampered by injuries, which was a theme during his three-year stint in St. Louis. He only saw 559 plate appearances that season, just the 44th most in the NL, but something caught my eye and curiosity when looking at his stats: He still eclipsed 30 home runs, 100 walks, and 100 strikeouts. He was the epitome of a three true outcomes player.

Thinking that must be rare, I did a search on the Play Index for all players since 1901 who had less than 600 plate appearances, but also reached at least 30 home runs, 100 walks, and 100 strikeouts. The result? Only ten total seasons. Ten. 

Screen Shot 2017-10-16 at 8.47.28 PM

And, as you see, at the time Clark’s was the first. Perhaps that’s a result of the Play Index whiffing on seasons from way back when, but I doubt it. In my experience the Play Index is as good of a research tool you’ll find for baseball stats, and this is likely a product of evolution. Take a look at players who qualified for a batting title 40 or 50 years ago and you’ll see that they simply didn’t strike out as much as they do today.

Last thing, of Clark’s 559 plate appearances in 1987, 56 percent ended in a home run, walk, or strikeout. That’s the highest on the list above, save for that magical Jack Cust season, which came in right at 57 percent. (It strangely makes me happy that guys named Jack Clark and Jack Cust excel at this skill.) Fifty-seven percent. That’s the same percentage of three true outcomes turned in this season by rookie Aaron Judge, who led the American League in all three categories. In that sense, Jack Clark, true renaissance man, was ahead of his time.

Credit to the Baseball Reference Play Index for most of the stats in this post. Subscribe to the Play Index here.

On home plate collisions, including the famous Ray Lankford play

By now you’ve probably seen or at least read about the most talked about play from last night’s Game 1 of the NLCS, a 5-2 Dodgers victory. But in case you missed it, here’s the Cliff Notes version:

In the bottom of the 7th inning, Charlie Culberson attempted to score from second on a single to left but was initially called out for not touching the plate and being tagged by catcher Willson Contreras. In both real time and on replay, Contreras quite clearly stuck out his left leg before receiving the ball, thereby blocking Culberson’s path to the plate. After a review, Culberson was called safe, Manager Joe Maddon went nuts, got tossed, and the Dodgers now lead 1-0.

A couple of things:

Who knows for certain why Contreras stuck out his left leg – Joe Sheehan noted this morning on Twitter that a lot of people are claiming he did it for positional balance – but I suspect he instinctively did it to prevent Culberson from easily reaching home. In the moment, that’s pretty understandable. I also suspect a lot of catchers would have done the same thing. But this seems like a pretty textbook example of why this rule (often called the Buster Posey rule, although Grant Brisbee has pointed out that’s an erroneous moniker) was created in the first place. If you wanted to show an audience an obvious example of what you can no longer do as a catcher per the rule book, you’d be hard-pressed to find a better one.

My experience with this rule and its application, which to put it mildly is quite anecdotal, is that MLB has not done the best job articulating it nor enforcing it. MLB would be better served making sure the runner is always called safe in this situation (i.e., when the catcher intentionally blocks the runner’s path before receiving the ball), whether it’s the regular season, or Game 7 of the World Series. Still, they got the call right last night, and that’s a step in the right direction.

After the game, Joe Maddon had a few thoughts on the situation, most notably this one:

He’s sticking up for his players, which is fine and understandable, but that’s a dumb and boorish thing to say. I’m guessing Buster Posey is fine with the rule. We know Mike Matheny is. They have about 8,500 combined plate appearances at the highest level of baseball compared to Maddon’s zero.

Lastly, any time I see a play litigated like that at the plate, I think of Ray Lankford bowling over Darren Daulton in April 1991, even though it’s an entirely different play altogether. In case you haven’t seen it, here you go:

Ouch.

This play was celebrated by Cardinals fans at the time and still is. And again, this is apples and oranges to last night in that the throw brought Daulton directly into Lankford’s path making him a sitting duck to no fault of his own. Conversely, Lankford really didn’t do anything wrong either. But shoot, that’s hard to watch. Anything baseball can do to limit violent collisions like this is in the best interest for all involved. The Lankford play might be harder to avoid, but a home plate collision was possibly prevented last night and that’s a good thing.

Play Index: Tommy Pham slash line edition

As I’m typing this, the Chicago Cubs are on my television screen playing postseason baseball (UPDATE: gross) and the Cardinals are not, a fair indicator that 2017 was not much fun. There were exceptions, the biggest one being Tommy Pham. I imagine the rest of the baseball universe grew a bit tired of the Cardinals’ side of the aisle constantly screaming about Tommy Pham, but they’ll have to forgive us. This was a 29-year old career minor leaguer/resident of the DL with less than 320 career plate appearances to his name putting up a .300/.400/.500 line in his first full season. It was like something from a sports movie.

And you saw that correctly, Pham had a .300/.400/.500 season, one of only seven for qualified batters in all of baseball. Here they are, via Baseball Reference’s Play Index as sorted by wins above replacement:

Screen Shot 2017-10-12 at 9.21.29 PM

Pretty decent company. Also, this is why Pham – a guy who in April wasn’t even deemed worthy of being the fourth outfielder – has a legitimate shot to finish in the top-five in National League MVP voting. And that’s insane.

Further, here’s a tweet earlier this week from must-follow and all-around decent guy @SimulacruMusial:

Similar to above, this had me wondering how these numbers stacked up with recent Cardinals seasons. So again, using the Play Index, I searched for Cardinals who qualified for the batting title going back to 1988 who either equaled or eclipsed all of Pham’s numbers from above (because Baseball Reference doesn’t use wOBA or wRC+, I substituted in Pham’s 144 OPS+), and this is what I found:

Screen Shot 2017-10-12 at 10.04.19 PM

First, these are always good exercises to ensure that Albert Pujols’s time in St. Louis is properly appreciated. Second, going back 30 seasons, only two Cardinals have turned in a better slash line across the board than Pham’s 2017, and you have to go back to 1971 to find a third (Joe Torre – .363/.421/.555; 171 OPS+). We weren’t imagining anything, Pham had a phenomenal season.

A quick rundown of a few of the other notable seasons that popped up in my head: The two other MV3s in 2004 were close. Scott Rolen just missed with a .409 on-base percentage (.314/.409/.598; 158 OPS+). Jim Edmonds fell short by hitting .301 (.301/.418/.643; 171 OPS+). Ray Lankford was similarly close in 1997 (.295/.411/.585; 159 OPS+). In 2013, Matt Carpenter missed the .300/.400/.500 mark in both on-base and slugging and had a lower OPS+ than Pham’s (.318/.392/.481; 140 OPS+).

The takeaway is that even when a season doesn’t go as planned, there’s often something positive worth remembering. In 2016 it was the offense coming out of nowhere and slugging their way to the top of the leaderboard. In 2017, it was Tommy Pham.

Credit to the Baseball Reference Play Index for most of the stats in this post. Subscribe to the Play Index here.